What are Financial Market Indicators?
Financial market indicators are essential tools for traders and investors, providing valuable insights into market trends and helping individuals make informed decisions. This comprehensive guide will delve into the intricacies of key financial market indicators, explaining how they work, their importance, and how to effectively use them to navigate the complexities of financial markets and make strategic, profitable investments.
What are Financial Market Indicators?
Financial market indicators are statistical measures that reflect the current state of financial markets and economies. These indicators can be broadly categorized into economic indicators, market sentiment indicators, and technical indicators. Each category serves a unique purpose and provides different insights into market conditions.

Types of Financial Market Indicators
Economic Indicators
Economic indicators are statistics that reflect the overall health of an economy. They are often used by traders and investors to gauge economic performance and predict future market movements. Key economic indicators include:
Gross Domestic Product (GDP): GDP measures the total value of goods and services produced within a country. It is a crucial indicator of economic health. A growing GDP indicates a healthy economy, while a declining GDP may signal economic trouble. For instance, a consistent increase in GDP suggests that businesses are producing more, consumers are spending more, and the economy is expanding. Conversely, a declining GDP can indicate a slowdown in economic activity, leading to potential recession concerns.
Unemployment Rate: The unemployment rate indicates the percentage of the labor force that is unemployed and actively seeking employment. High unemployment rates can indicate economic distress, while low rates suggest economic stability. For example, during a recession, the unemployment rate typically rises as businesses cut back on hiring or lay off workers. Conversely, during periods of economic growth, the unemployment rate tends to fall as companies expand and hire more employees.
Inflation Rate: Inflation measures the rate at which prices for goods and services rise over time. Moderate inflation is a sign of a growing economy, but hyperinflation or deflation can signal economic issues. For instance, moderate inflation can encourage spending and investment, as consumers and businesses expect prices to rise in the future. However, high inflation can erode purchasing power, leading to decreased consumer spending and economic instability.
Interest Rates: Interest rates, set by central banks, influence borrowing and spending behaviors. Lower rates encourage borrowing and investing, while higher rates can slow down economic activity. For example, when interest rates are low, businesses can borrow money at a lower cost to invest in expansion projects, and consumers can take out loans for big-ticket items like homes and cars. Conversely, when interest rates are high, borrowing becomes more expensive, potentially slowing down economic activity as both businesses and consumers cut back on spending.
Technical Indicators
Technical indicators are mathematical calculations based on historical price, volume, or open interest data. They are used by traders to predict future price movements. Key technical indicators include:
Moving Averages (MA): Moving averages are calculated by averaging a security’s price over a specific period. They smooth out price data to identify trends. The two most common types are the Simple Moving Average (SMA) and the Exponential Moving Average (EMA). For instance, the 50-day SMA is calculated by averaging the closing prices of a security over the past 50 days. If the price is above the 50-day SMA, it suggests an uptrend, while a price below the 50-day SMA indicates a downtrend. The EMA gives more weight to recent prices, making it more responsive to new information.
Relative Strength Index (RSI): The RSI measures the magnitude of recent price changes to evaluate overbought or oversold conditions. An RSI above 70 suggests overbought conditions, while an RSI below 30 indicates oversold conditions. For example, if a stock’s RSI is above 70, it may be a signal that the stock is overbought and could be due for a price correction. Conversely, if the RSI is below 30, it may indicate that the stock is oversold and could be due for a price rebound.
Moving Average Convergence Divergence (MACD): The MACD is a trend-following indicator that shows the relationship between two moving averages of a security’s price. It is used to identify potential buy and sell signals. For instance, when the MACD line crosses above the signal line, it generates a bullish signal, suggesting it may be a good time to buy. Conversely, when the MACD line crosses below the signal line, it generates a bearish signal, suggesting it may be a good time to sell.
External links:
Importance of Financial Market Indicators
Enhancing Decision-Making
Financial market indicators provide critical information that helps traders and investors make informed decisions. By understanding these indicators, individuals can better interpret market signals, identify trends, and develop effective trading strategies. This knowledge reduces the risk of making uninformed decisions and increases the potential for profitable investments. For example, a trader who understands how to interpret economic indicators like GDP and inflation can better anticipate market movements and adjust their investment strategies accordingly.
Identifying Trends and Patterns
Indicators help in identifying trends and patterns in the market. For example, moving averages can highlight long-term trends, while oscillators like the RSI can indicate potential reversal points. Recognizing these trends and patterns allows traders to enter and exit positions more strategically. For instance, a trader might use the 50-day and 200-day moving averages to identify long-term trends, while using the RSI to spot potential short-term reversals.
Gauging Market Sentiment
Market sentiment indicators provide insights into the collective mood of investors. By understanding whether the market sentiment is bullish or bearish, traders can align their strategies accordingly. For instance, during times of high volatility, traders might adopt more conservative strategies to protect their investments. Conversely, during periods of low volatility and high investor confidence, traders might take on more risk in pursuit of higher returns.
Predicting Future Movements
While no indicator can predict the future with certainty, many can provide valuable forecasts. For instance, leading economic indicators like new orders for durable goods can give early signs of economic expansion or contraction. Similarly, technical indicators can signal potential price movements, helping traders anticipate market changes. For example, if the MACD generates a bullish signal and the RSI is below 70, a trader might anticipate a price increase and decide to buy.
How to Use Financial Market Indicators Effectively
Combining Multiple Indicators
Relying on a single indicator can be risky, as it might not provide a complete picture of the market. Instead, combining multiple indicators can offer more comprehensive insights. For example, using both moving averages and the RSI can help confirm trends and identify potential reversal points. This approach can increase the accuracy of trading signals and reduce the likelihood of false signals.
Understanding Indicator Limitations
No indicator is perfect. Each has its limitations and can provide false signals. It’s essential to understand the strengths and weaknesses of each indicator and use them in conjunction with other tools and analysis methods. For example, moving averages can be lagging indicators, meaning they may not provide timely signals during rapid market changes. Therefore, traders should consider using leading indicators like the RSI or MACD to complement moving averages.
Staying Updated
Financial markets are dynamic and constantly changing. Regularly updating your knowledge of indicators and staying
informed about economic events and news can help you make more accurate predictions and better trading decisions. For example, staying updated on central bank announcements, economic data releases, and geopolitical events can provide valuable context for interpreting market indicators.
Practical Examples of Financial Market Indicators in Use
Case Study: Using GDP and Interest Rates for Long-Term Investments
An investor looking to make long-term investments might focus on GDP and interest rates. For instance, if a country’s GDP is growing steadily and the central bank is maintaining low interest rates, it suggests a conducive environment for economic growth. This scenario might lead the investor to invest in equities, anticipating higher corporate profits and stock price appreciation. Conversely, if GDP is declining and interest rates are rising, the investor might shift their focus to more defensive investments, such as bonds or dividend-paying stocks.
Case Study: Applying Technical Indicators for Short-Term Trading
A short-term trader might use technical indicators like the MACD and RSI to make quick trading decisions. Suppose the MACD line crosses above the signal line, indicating a potential buy signal, and the RSI is below 70, suggesting the stock is not overbought. The trader might decide to enter a buy position, expecting the stock price to rise in the short term. Conversely, if the MACD line crosses below the signal line and the RSI is above 70, the trader might decide to sell, anticipating a price decline.
Detailed Examination of Key Financial Market Indicators
Gross Domestic Product (GDP)
What is GDP?
GDP measures the total value of goods and services produced within a country over a specific period, usually a year or a quarter. It is one of the most comprehensive indicators of economic activity and health. GDP can be measured in three ways: production, income, and expenditure. The production approach sums the output of every enterprise, the income approach sums the incomes of all producers in the country, and the expenditure approach sums the total spending on the nation’s final goods and services.
Why is GDP Important?
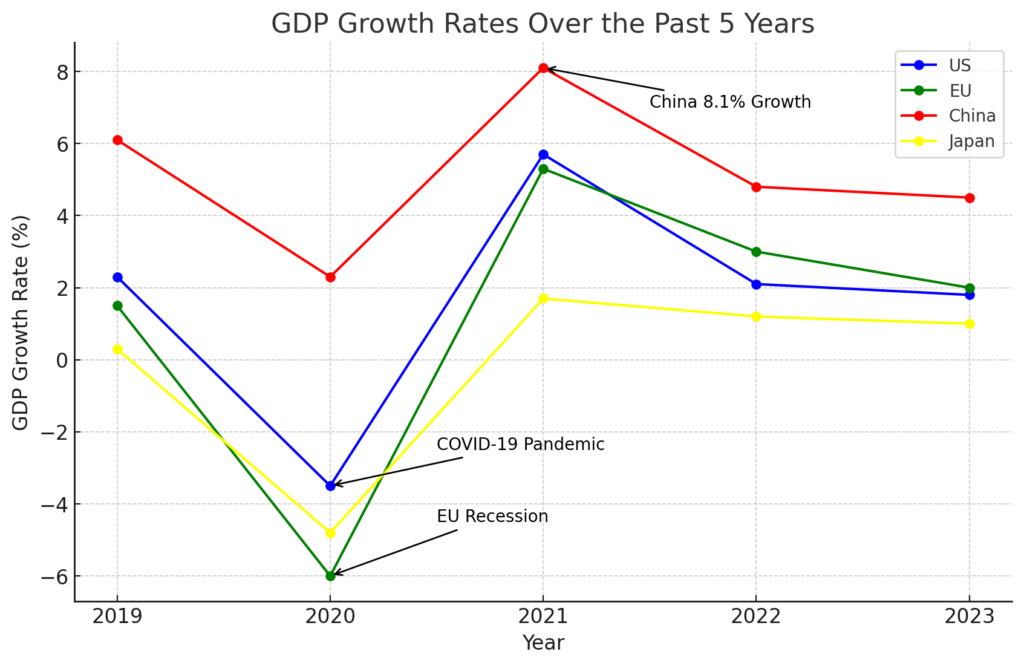
GDP is crucial because it provides a snapshot of a country’s economic performance. A growing GDP indicates that the economy is expanding, businesses are producing more, and consumers are spending more. Conversely, a declining GDP can signal economic problems, such as a recession. For example, during the 2008 financial crisis, many countries experienced significant GDP contractions, reflecting the severe economic downturn.
How to Use GDP in Investment Decisions
Investors use GDP data to make informed decisions about asset allocation and investment strategies. For example, if a country’s GDP is growing, investors might consider investing in that country’s equities, anticipating that corporate profits will increase. Conversely, if GDP is contracting, investors might shift their focus to more defensive assets like bonds or gold.
Unemployment Rate

What is the Unemployment Rate?
The unemployment rate measures the percentage of the labor force that is unemployed and actively seeking employment. It is a lagging indicator, meaning it typically rises or falls after the economy has begun to contract or expand. The unemployment rate is calculated by dividing the number of unemployed individuals by the total labor force and multiplying by 100.
Why is the Unemployment Rate Important?
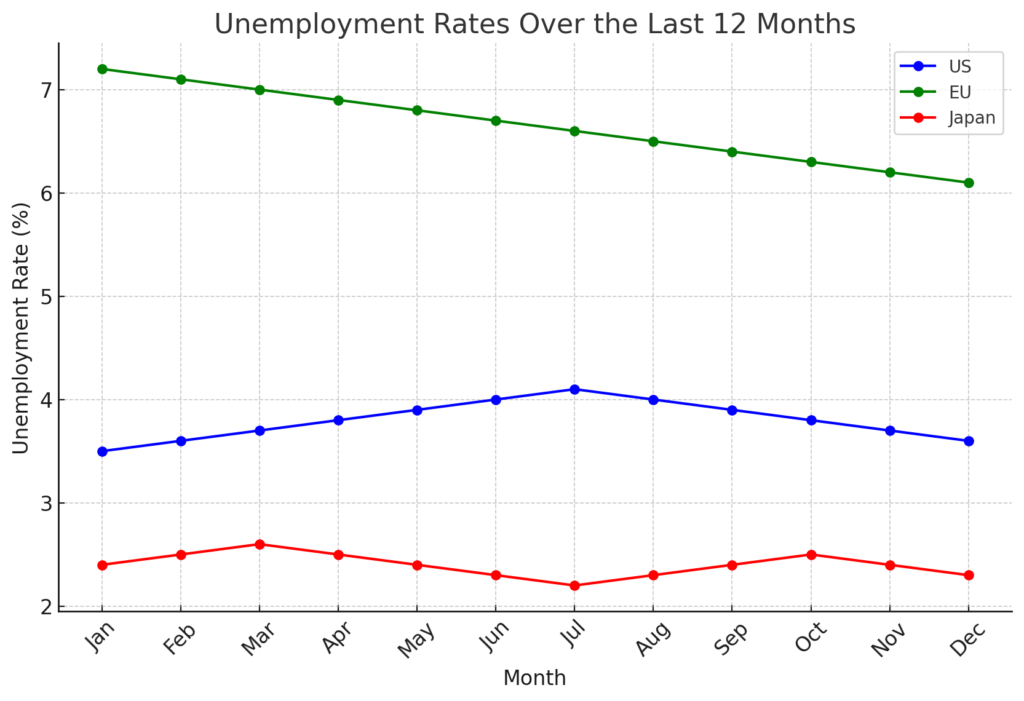
The unemployment rate is an important indicator of economic health. High unemployment rates indicate economic distress, as more people are out of work and not earning income. This can lead to decreased consumer spending and slower economic growth. Conversely, low unemployment rates suggest a stable economy with more people working and earning income, leading to increased consumer spending and economic growth.
How to Use the Unemployment Rate in Investment Decisions
Investors use the unemployment rate to gauge the overall health of the economy and make informed decisions about asset allocation. For example, if the unemployment rate is low and falling, it suggests that the economy is strong, which can be positive for equities. Conversely, if the unemployment rate is high and rising, it may indicate economic problems, prompting investors to consider more defensive assets like bonds or gold.
Inflation Rate
What is the Inflation Rate?
Inflation measures the rate at which prices for goods and services rise over time. It is calculated by taking the percentage change in a price index, such as the Consumer Price Index (CPI) or the Producer Price Index (PPI), over a specific period. Inflation can be influenced by various factors, including supply and demand dynamics, monetary policy, and global economic conditions.
Why is the Inflation Rate Important?
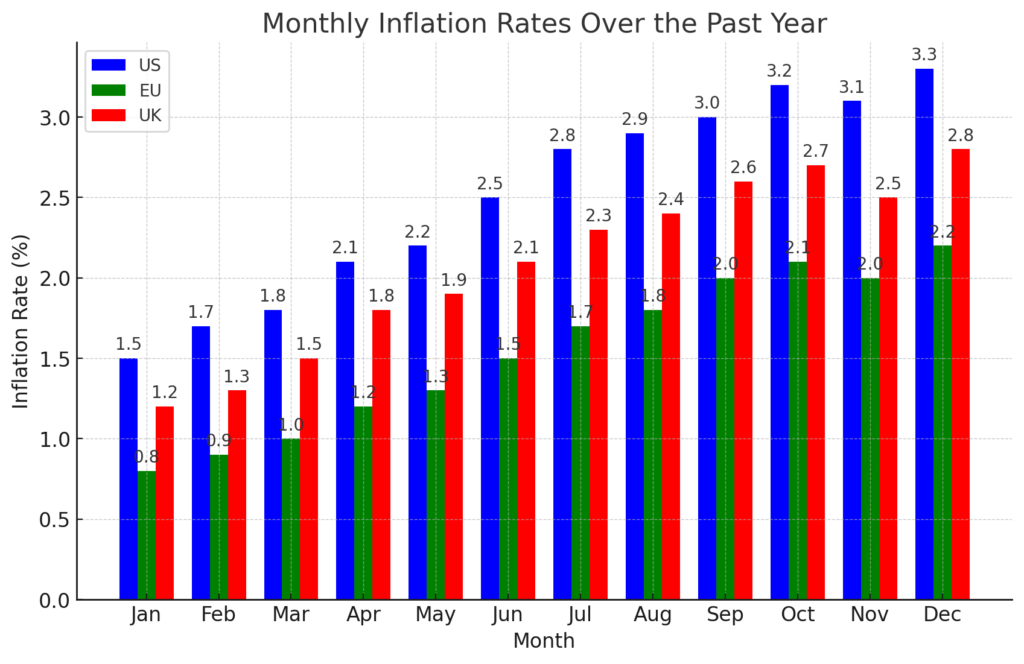
The inflation rate is important because it affects purchasing power and the cost of living. Moderate inflation is a sign of a growing economy, but hyperinflation or deflation can signal economic issues. For example, hyperinflation can erode the value of money, leading to decreased consumer spending and economic instability. Conversely, deflation can lead to decreased spending and investment, as consumers and businesses anticipate lower prices in the future.
How to Use the Inflation Rate in Investment Decisions
Investors use the inflation rate to make informed decisions about asset allocation and investment strategies. For example, during periods of high inflation, investors might consider investing in assets that can provide a hedge against inflation, such as commodities or inflation-linked bonds. Conversely, during periods of low inflation, investors might focus on growth assets like equities, as the cost of borrowing is typically lower.
Interest Rates
What are Interest Rates?
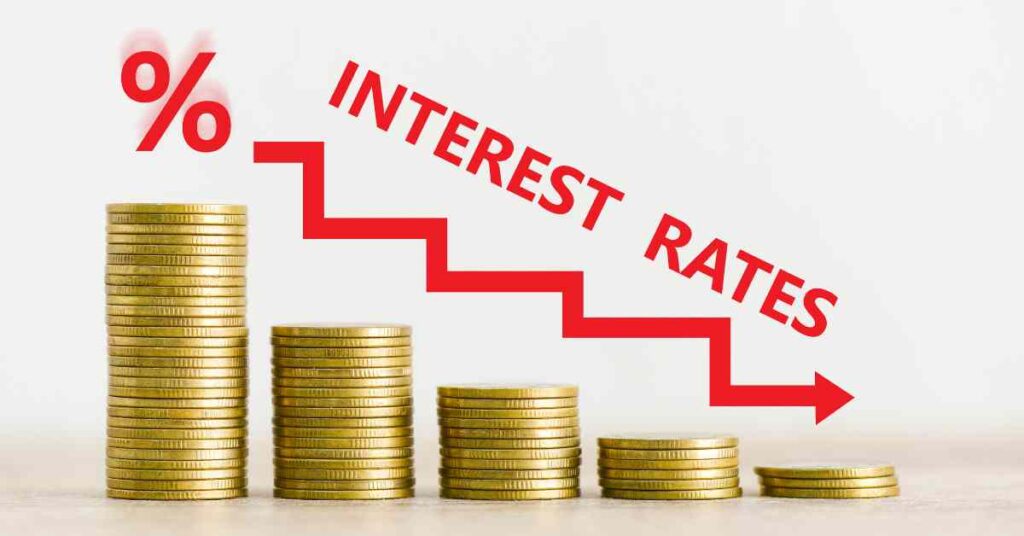
Interest rates are the cost of borrowing money, typically set by central banks. They influence borrowing and spending behaviors, as well as the overall cost of credit in the economy. Central banks use interest rates as a tool to control inflation and stimulate or slow down economic activity.
Why are Interest Rates Important?
Interest rates are important because they influence economic activity and financial markets. Lower rates encourage borrowing and investing, while higher rates can slow down economic activity. For example, when interest rates are low, businesses can borrow money at a lower cost to invest in expansion projects, and consumers can take out loans for big-ticket items like homes and cars. Conversely, when interest rates are high, borrowing becomes more expensive, potentially slowing down economic activity as both businesses and consumers cut back on spending.
How to Use Interest Rates in Investment Decisions
Investors use interest rates to make informed decisions about asset allocation and investment strategies. For example, when interest rates are low, investors might consider investing in equities, as lower borrowing costs can lead to higher corporate profits. Conversely, when interest rates are high, investors might shift their focus to fixed-income securities like bonds, which can offer higher yields.
Volatility Index (VIX)

What is the VIX?
The VIX, often referred to as the “fear gauge,” measures market volatility expectations. It is calculated based on the prices of options on the S&P 500 index and reflects investor sentiment about future market volatility. A high VIX indicates increased fear and uncertainty, while a low VIX suggests investor confidence.
Why is the VIX Important?
The VIX is important because it provides insights into market sentiment and investor behavior. High VIX values indicate increased fear and uncertainty, which can lead to higher market volatility and potential price declines. Conversely, low VIX values suggest investor confidence, which can lead to lower market volatility and potential price increases.
How to Use the VIX in Investment Decisions
Investors use the VIX to gauge market sentiment and make informed decisions about asset allocation and risk management. For example, during times of high volatility, investors might adopt more conservative strategies to protect their investments, such as increasing cash holdings or diversifying into defensive assets like bonds or gold. Conversely, during periods of low volatility, investors might take on more risk in pursuit of higher returns.
Put/Call Ratio

What is the Put/Call Ratio?
The put/call ratio compares the number of put options to call options traded in the market. A put option gives the holder the right to sell an asset at a specified price, while a call option gives the holder the right to buy an asset at a specified price. The put/call ratio is calculated by dividing the number of put options by the number of call options.
Why is the Put/Call Ratio Important?
The put/call ratio is important because it provides insights into market sentiment and investor behavior. A high put/call ratio indicates bearish sentiment, as more investors are buying put options to protect against potential price declines. Conversely, a low put/call ratio suggests bullish sentiment, as more investors are buying call options in anticipation of price increases.
How to Use the Put/Call Ratio in Investment Decisions
Investors use the put/call ratio to gauge market sentiment and make informed decisions about asset allocation and risk management. For example, during times of high bearish sentiment, investors might adopt more conservative strategies to protect their investments, such as increasing cash holdings or diversifying into defensive assets like bonds or gold. Conversely, during periods of bullish sentiment, investors might take on more risk in pursuit of higher returns.
Consumer Confidence Index (CCI)

What is the CCI?
The CCI measures how optimistic or pessimistic consumers are regarding their financial situation and the overall economy. It is calculated based on surveys of households and reflects consumer sentiment about current and future economic conditions. A high CCI indicates high consumer confidence, while a low CCI suggests low consumer confidence.
Why is the CCI Important?
The CCI is important because it provides insights into consumer behavior and spending patterns. High consumer confidence often leads to increased spending and investment, driving economic growth. Conversely, low consumer confidence can lead to decreased spending and investment, potentially slowing down economic growth.
How to Use the CCI in Investment Decisions
Investors use the CCI to gauge consumer sentiment and make informed decisions about asset allocation and investment strategies. For example, during times of high consumer confidence, investors might consider investing in equities, as increased consumer spending can lead to higher corporate profits. Conversely, during periods of low consumer confidence, investors might shift their focus to more defensive assets like bonds or gold.
Moving Averages (MA)
What are Moving Averages?
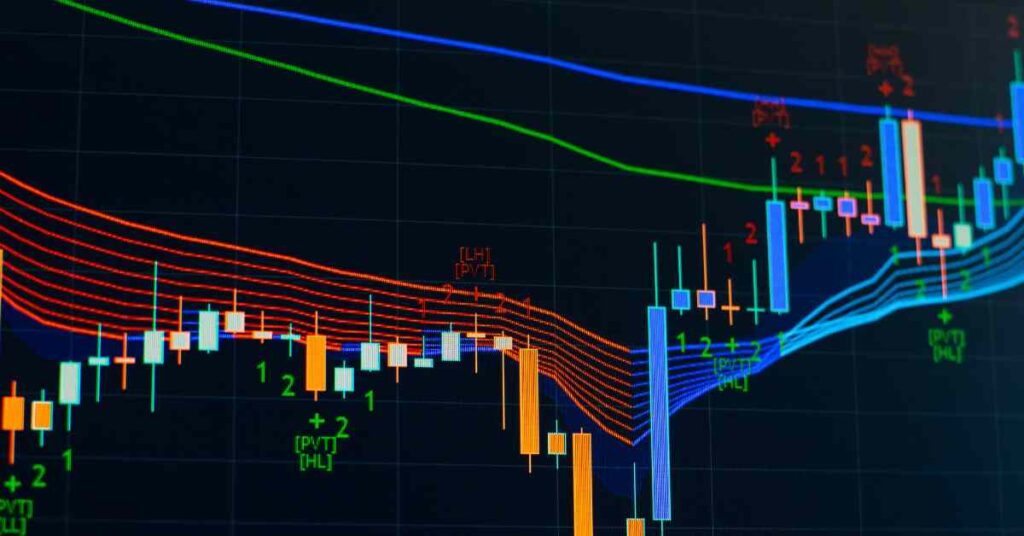
Moving averages are calculated by averaging a security’s price over a specific period. They smooth out price data to identify trends and are commonly used in technical analysis. The two most common types are the Simple Moving Average (SMA) and the Exponential Moving Average (EMA).
Why are Moving Averages Important?
Moving averages are important because they help identify trends and potential reversal points. They can also be used to generate buy and sell signals. For example, if the price of a security is above its moving average, it suggests an uptrend, while a price below the moving average indicates a downtrend.
How to Use Moving Averages in Investment Decisions
Investors use moving averages to identify trends and make informed decisions about asset allocation and trading strategies. For example, a trader might use the 50-day and 200-day moving averages to identify long-term trends, while using shorter-term moving averages like the 10-day or 20-day moving averages to spot potential short-term reversals. Additionally, investors can use moving average crossovers to generate buy and sell signals. For instance, when the short-term moving average crosses above the long-term moving average, it generates a bullish signal, suggesting it may be a good time to buy. Conversely, when the short-term moving average crosses below the long-term moving average, it generates a bearish signal, suggesting it may be a good time to sell.
Relative Strength Index (RSI)
What is the RSI?
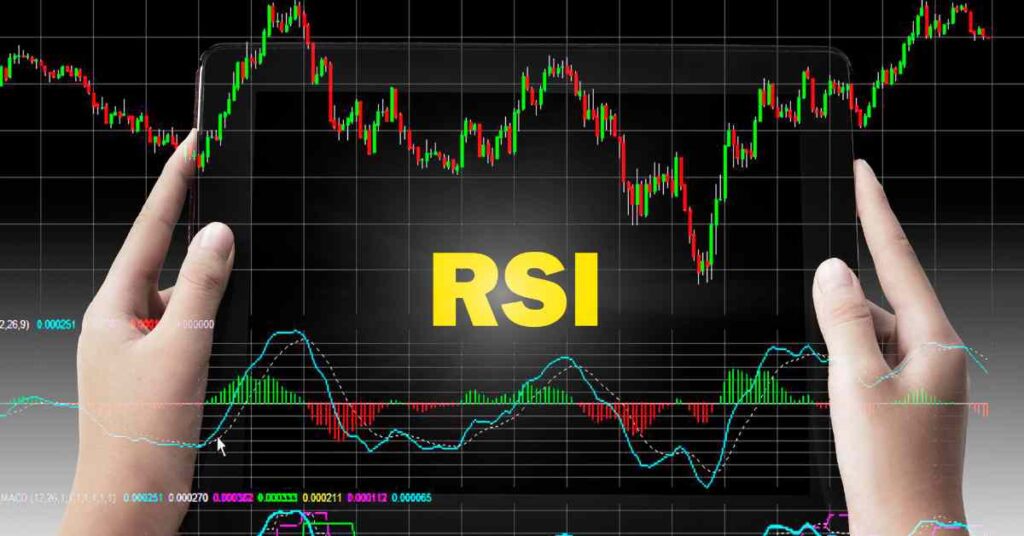
The RSI measures the magnitude of recent price changes to evaluate overbought or oversold conditions. It is calculated using the formula RSI = 100 – (100 / (1 + RS)), where RS is the average of the up closes divided by the average of the down closes over a specified period. The RSI ranges from 0 to 100, with readings above 70 indicating overbought conditions and readings below 30 indicating oversold conditions.
Why is the RSI Important?
The RSI is important because it helps identify potential reversal points and overbought or oversold conditions. It can also be used to generate buy and sell signals. For example, if the RSI is above 70, it suggests that the security is overbought and could be due for a price correction. Conversely, if the RSI is below 30, it indicates that the security is oversold and could be due for a price rebound.
How to Use the RSI in Investment Decisions
Investors use the RSI to identify potential reversal points and make informed decisions about asset allocation and trading strategies. For example, a trader might use the RSI to spot potential short-term reversals and enter or exit positions accordingly. Additionally, investors can use the RSI in conjunction with other technical indicators to confirm trends and generate buy and sell signals. For instance, if the RSI generates a bullish signal and the MACD also indicates a potential buy signal, the trader might decide to enter a buy position, anticipating a price increase.
Moving Average Convergence Divergence (MACD)

What is the MACD?
The MACD is a trend-following indicator that shows the relationship between two moving averages of a security’s price. It is calculated by subtracting the 26-day EMA from the 12-day EMA, and a nine-day EMA of the MACD line is plotted as the signal line. The MACD is used to identify potential buy and sell signals based on the convergence and divergence of the moving averages.
Why is the MACD Important?
The MACD is important because it helps identify trends and potential reversal points. It can also be used to generate buy and sell signals. For example, when the MACD line crosses above the signal line, it generates a bullish signal, suggesting it may be a good time to buy. Conversely, when the MACD line crosses below the signal line, it generates a bearish signal, suggesting it may be a good time to sell.
How to Use the MACD in Investment Decisions
Investors use the MACD to identify trends and make informed decisions about asset allocation and trading strategies. For example, a trader might use the MACD to spot potential short-term reversals and enter or exit positions accordingly. Additionally, investors can use the MACD in conjunction with other technical indicators to confirm trends and generate buy and sell signals. For instance, if the MACD generates a bullish signal and the RSI also indicates a potential buy signal, the trader might decide to enter a buy position, anticipating a price increase.
Practical Application of Financial Market Indicators
Combining Multiple Indicators for Comprehensive Analysis
Relying on a single indicator can be risky, as it might not provide a complete picture of the market. Instead, combining multiple indicators can offer more comprehensive insights. For example, using both moving averages and the RSI can help confirm trends and identify potential reversal points. This approach can increase the accuracy of trading signals and reduce the likelihood of false signals.
Case Study: Using GDP and Interest Rates for Long-Term Investments
An investor looking to make long-term investments might focus on GDP and interest rates. For instance, if a country’s GDP is growing steadily and the central bank is maintaining low interest rates, it suggests a conducive environment for economic growth. This scenario might lead the investor to invest in equities, anticipating higher corporate profits and stock price appreciation. Conversely, if GDP is declining and interest rates are rising, the investor might shift their focus to more defensive investments, such as bonds or dividend-paying stocks.
Case Study: Applying Technical Indicators for Short-Term Trading
A short-term trader might use technical indicators like the MACD and RSI to make quick trading decisions. Suppose the MACD line crosses above the signal line, indicating a potential buy signal, and the RSI is below 70, suggesting the stock is not overbought. The trader might decide to enter a buy position, expecting the stock price to rise in the short term. Conversely, if the MACD line crosses below the signal line and the RSI is above 70, the trader might decide to sell, anticipating a price decline.
Advanced Strategies Using Financial Market Indicators
Combining Economic and Technical Indicators
Combining economic and technical indicators can provide a more comprehensive analysis of market conditions. For example, an investor might use GDP and interest rate data to gauge the overall health of the economy and identify potential investment opportunities. At the same time, they might use technical indicators like moving averages and the RSI to time their entry and exit points more effectively.
Using Leading and Lagging Indicators
Leading indicators, such as new orders for durable goods and the consumer confidence index, provide early signals of economic trends. Lagging indicators, such as GDP and the unemployment rate, confirm trends after they have occurred. By combining leading and lagging indicators, investors can gain a more complete understanding of market conditions and make more informed decisions. For example, an investor might use leading indicators to identify potential investment opportunities and lagging indicators to confirm the strength of the trend.
Incorporating Sentiment Analysis
Sentiment analysis involves evaluating the mood or attitude of investors towards the market. This can be done through market sentiment indicators like the VIX and the put/call ratio, as well as through qualitative analysis of news articles, social media posts, and other sources of market sentiment. By incorporating sentiment analysis into their investment strategies, investors can gain insights into the collective mood of the market and adjust their strategies accordingly. For example, if sentiment indicators suggest high levels of fear and uncertainty, investors might adopt more conservative strategies to protect their investments. Conversely, if sentiment indicators suggest high levels of confidence, investors might take on more risk in pursuit of higher returns.
Challenges and Limitations of Financial Market Indicators
False Signals
One of the main challenges of using financial market indicators is the potential for false signals. No indicator is perfect, and each has its limitations. For example, moving averages can provide false signals during periods of market volatility, while the RSI can generate false buy or sell signals during prolonged trends. To mitigate the risk of false signals, investors should use multiple indicators and consider the broader context of market conditions.
Lagging Nature of Some Indicators
Many economic indicators, such as GDP and the unemployment rate, are lagging indicators, meaning they reflect past economic activity and may not provide timely signals during rapid market changes. To address this limitation, investors should complement lagging indicators with leading indicators and real-time data to gain a more accurate and timely understanding of market conditions.
Interpretation and Subjectivity
Interpreting financial market indicators can be subjective, as different investors may have different interpretations of the same data. For example, one investor might view a high put/call ratio as a sign of excessive bearish sentiment and a potential buying opportunity, while another investor might view it as a signal to stay out of the market. To reduce the risk of misinterpretation, investors should use a systematic approach to analyzing indicators and consider multiple perspectives.
Frequently Asked Questions (FAQs)
What is the best financial market indicator?
How often should I check financial market indicators?
Can financial market indicators predict market crashes?
How do economic indicators affect the stock market?
Are technical indicators suitable for long-term investments?
How can I combine multiple indicators for better analysis?
What are the limitations of financial market indicators?
Understanding financial market indicators is crucial for anyone involved in trading or investing. These indicators provide valuable insights into market conditions, helping individuals make informed decisions. By combining multiple indicators, staying updated, and recognizing their limitations, traders and investors can enhance their strategies and increase their chances of success. Whether you are a long-term investor or a short-term trader, incorporating financial market indicators into your decision-making process can help you navigate the complexities of financial markets and achieve your investment goals.
Resources
•Investopedia: Financial Indicators
•Federal Reserve Economic Data (FRED)
•Yahoo Finance: Market Sentiment Indicators
•Technical Analysis of Stock Trends by Robert D. Edwards and John Magee


